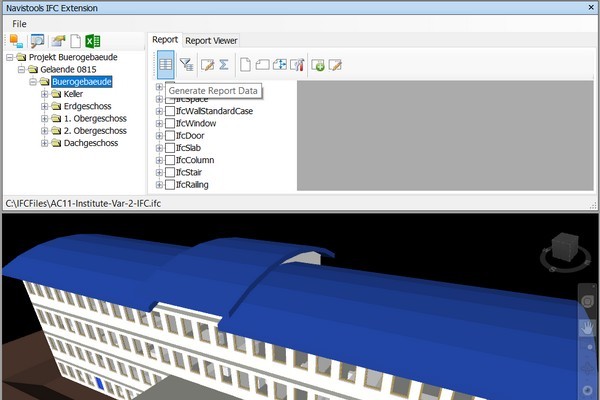
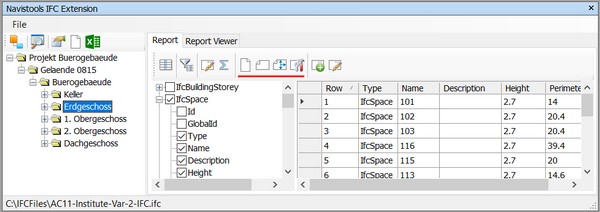
After switching to Report mode you can define which properties of currently selected tree node and its child nodes are included in the report.
Please select top tree node (Buerogebaeunde in this tutorial) from the left TreeView control. After that press Generate Report Data button to generate the right TreeView control with all property names included.
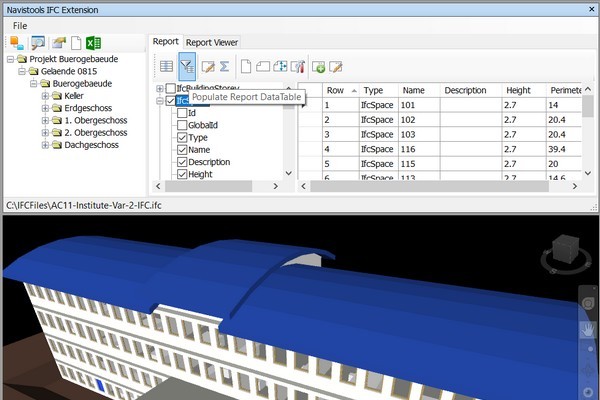
Now check all property names in the TreeView control that you want to include in the report and press Populate Report DataTable
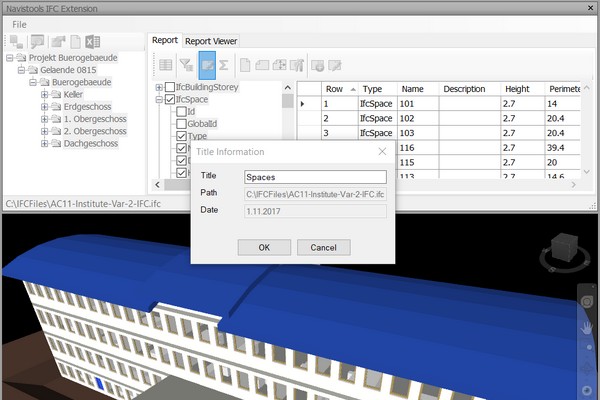
Define Report Heading Information
Final reports are generated based on the DataTable. The report will contain all data rows that are displayed in the DataTable and it will be formatted using the current DataTable formatting settings. In addition to this, the user can also define report heading information with the Report Header Information button. The following dialog will be displayed. Fill in title information and press OK.
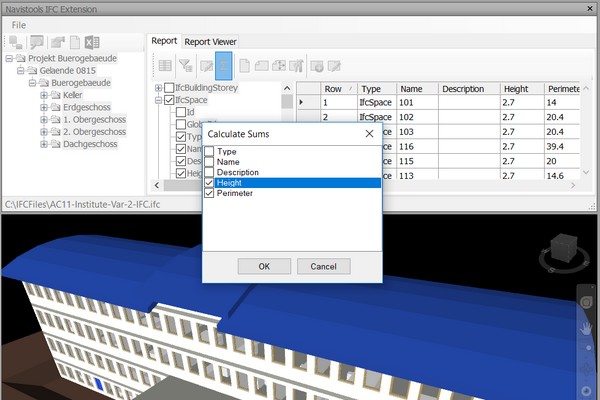
Select Fields to Calculate Sums
Select report fields of which you want to calculate sums. Only number fields are valid for this function.
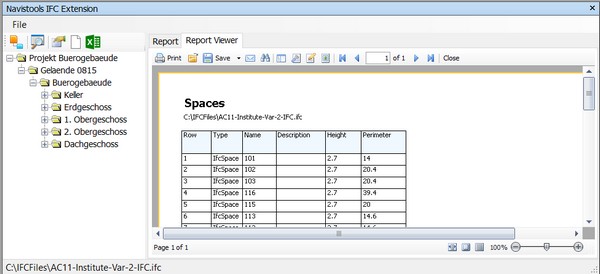
Create Report
You can create reports of currently selected fields and header information by selecting either the Create Portrait Report, Create Landscape Report, Create Continuous Report or Create Custom Report button.
The report will be sent to the ReportViewer control. The ReportViewer control includes a toolbar that provides navigation, search, export and print functionality so that reports can be used in a deployed application.
Custom Reports
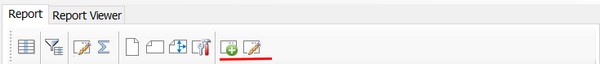
New Custom Report
You can create a new custom report with the FastReport editor. The Report template has predefined data source data and header. The Data Source fields can be used in the data and report title bands when designing a report.

After the report has been designed, it should be saved to the reports folder C:\Navistools2018\Reports. More information on designing reports can be found in the manual; FRNetUserManual.chm

Edit Custom Report
This Function asks for selection of a saved custom report and opens it with the FastReport editor.
